Thoughts
Combining React and D3
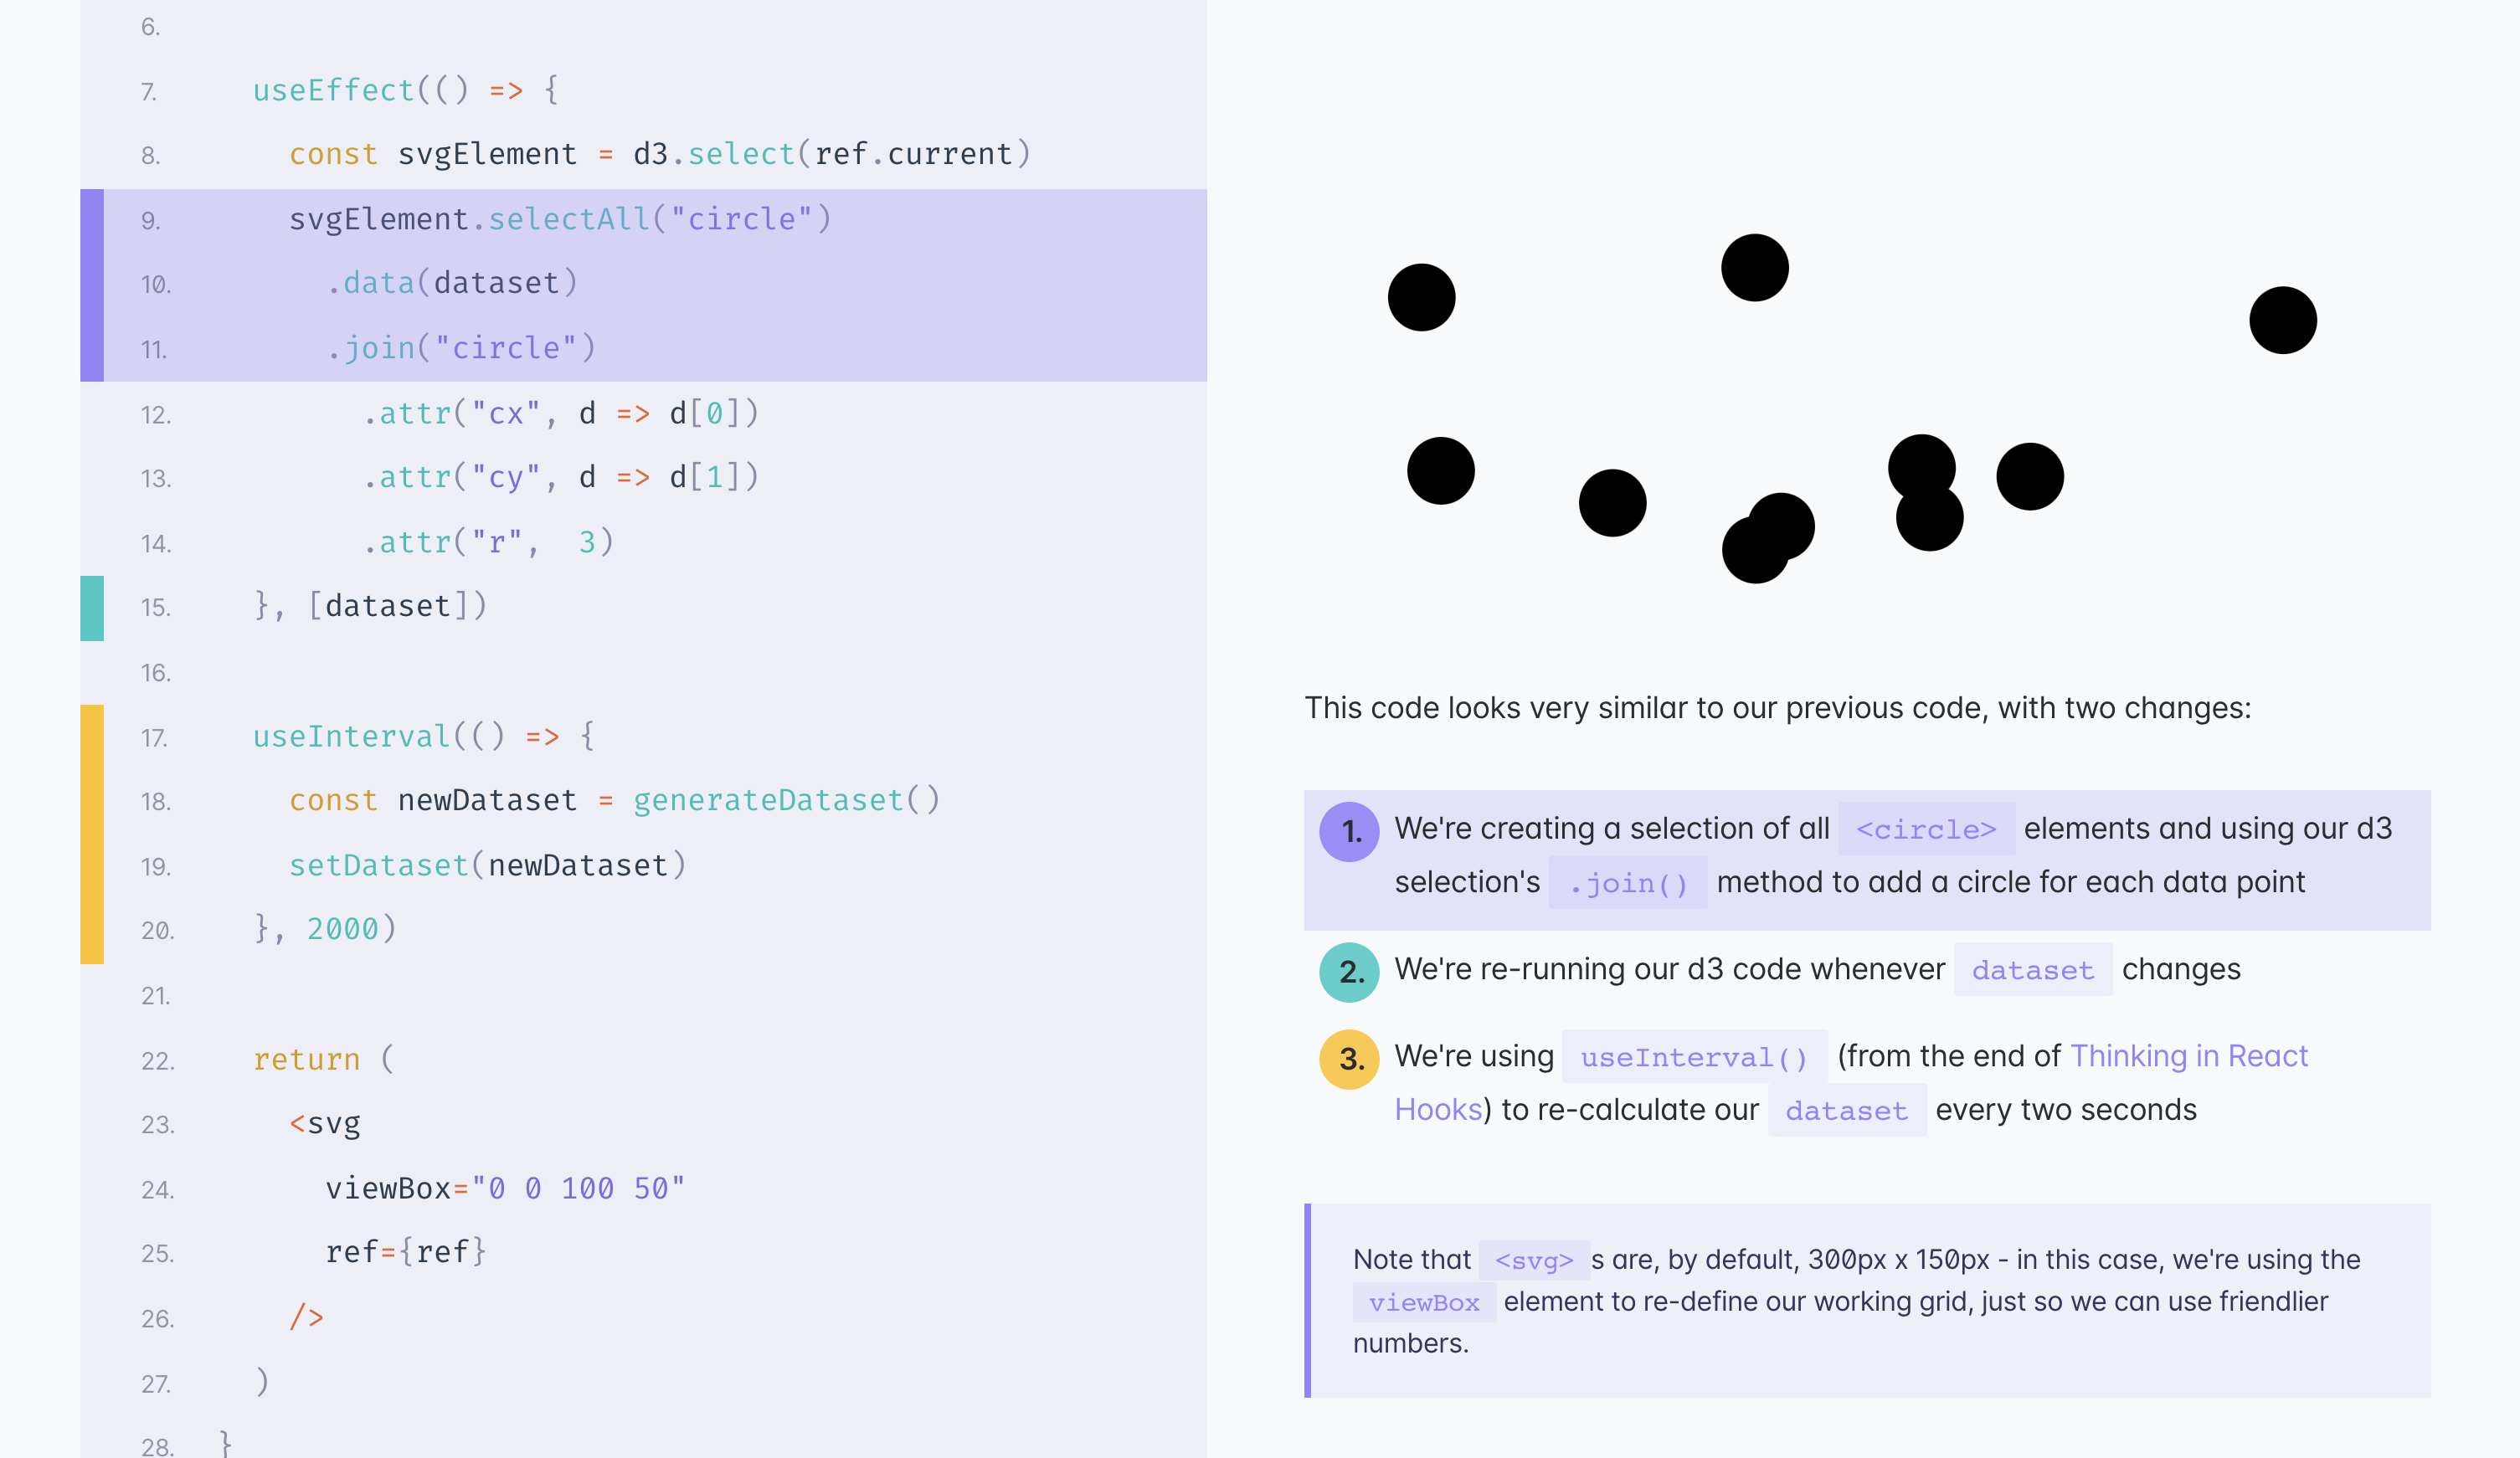
When I visualize data on the web, my current favorite environment is using D3.js inside of a React.js application. These two technologies are notoriously tricky to combine. Here's my opinionated guide to living with both, in harmony.
Use the d3 force
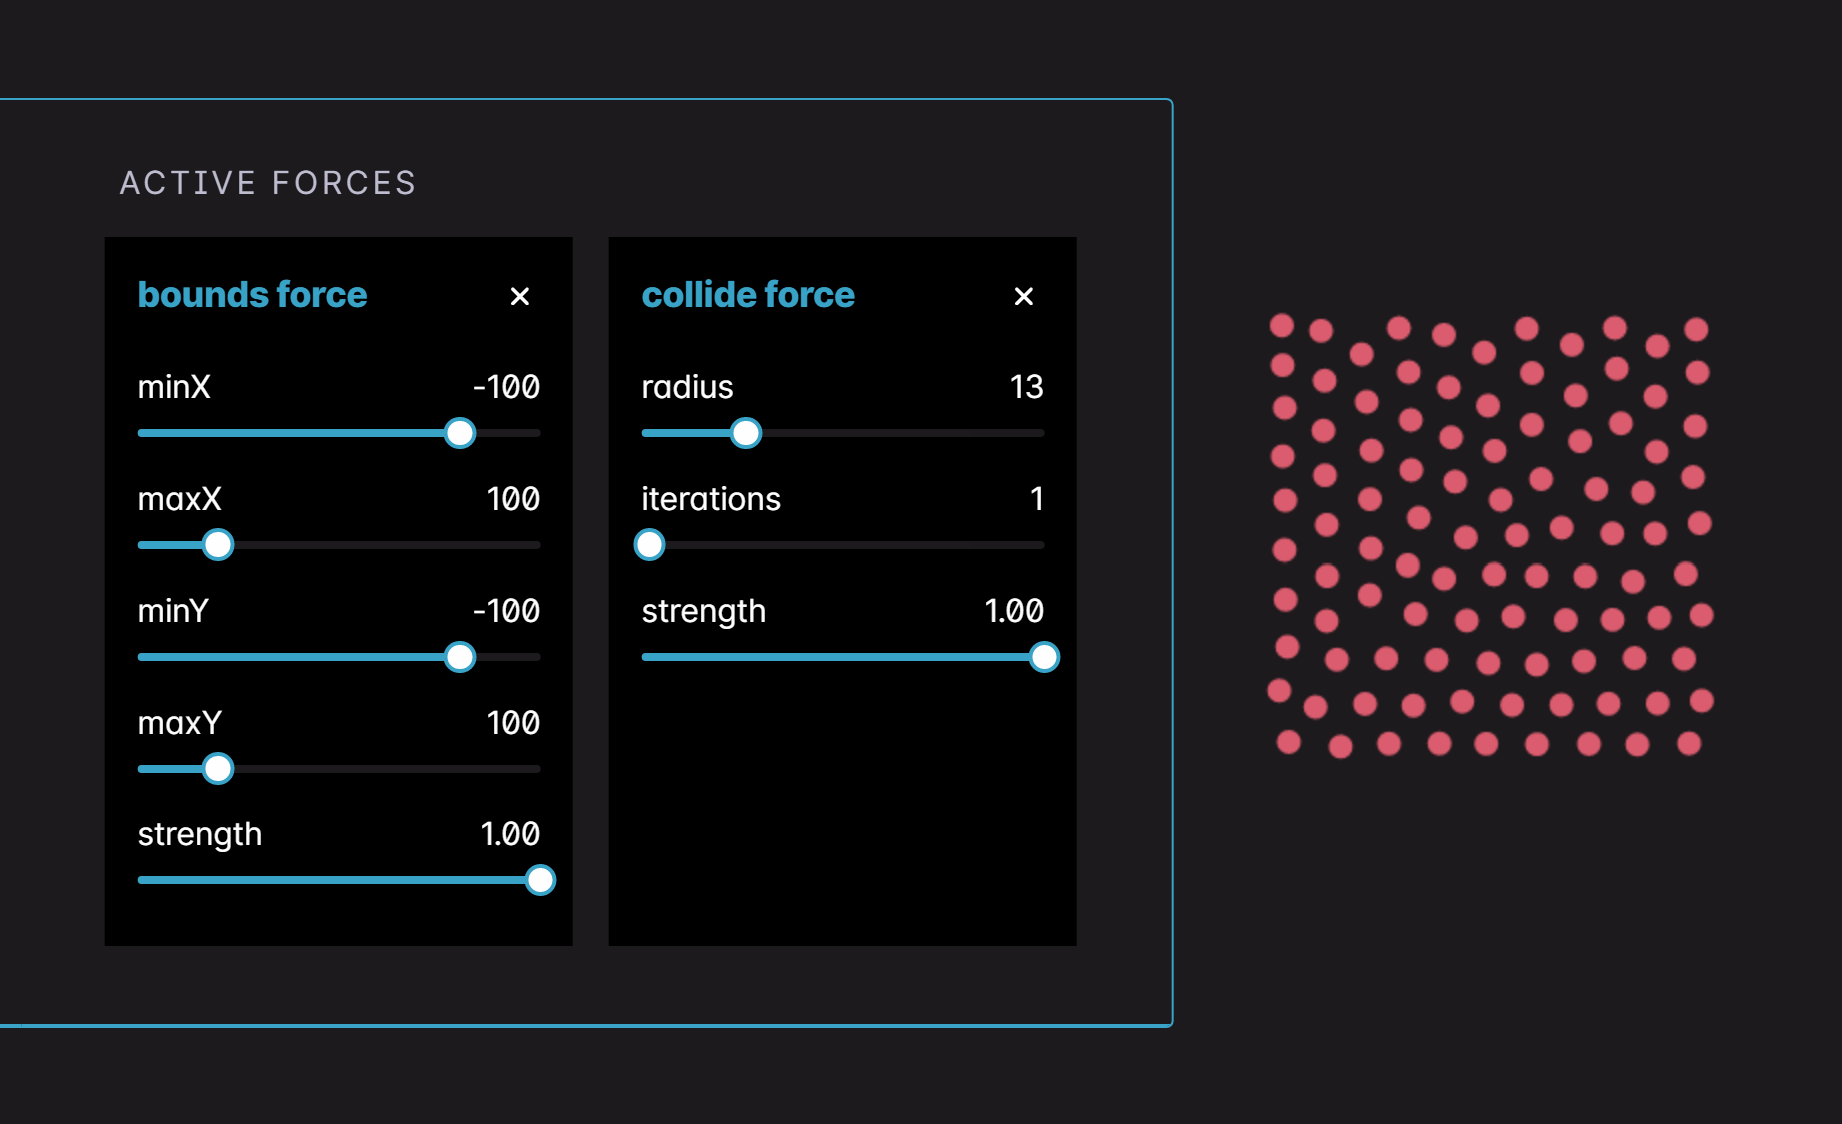
Usually, we position elements on our web pages in static, explicit places. But what if we want to make them feel more alive, or move them based on loose rules? Let's learn how to move particles with forces using d3-force.
What does 100% mean in CSS?
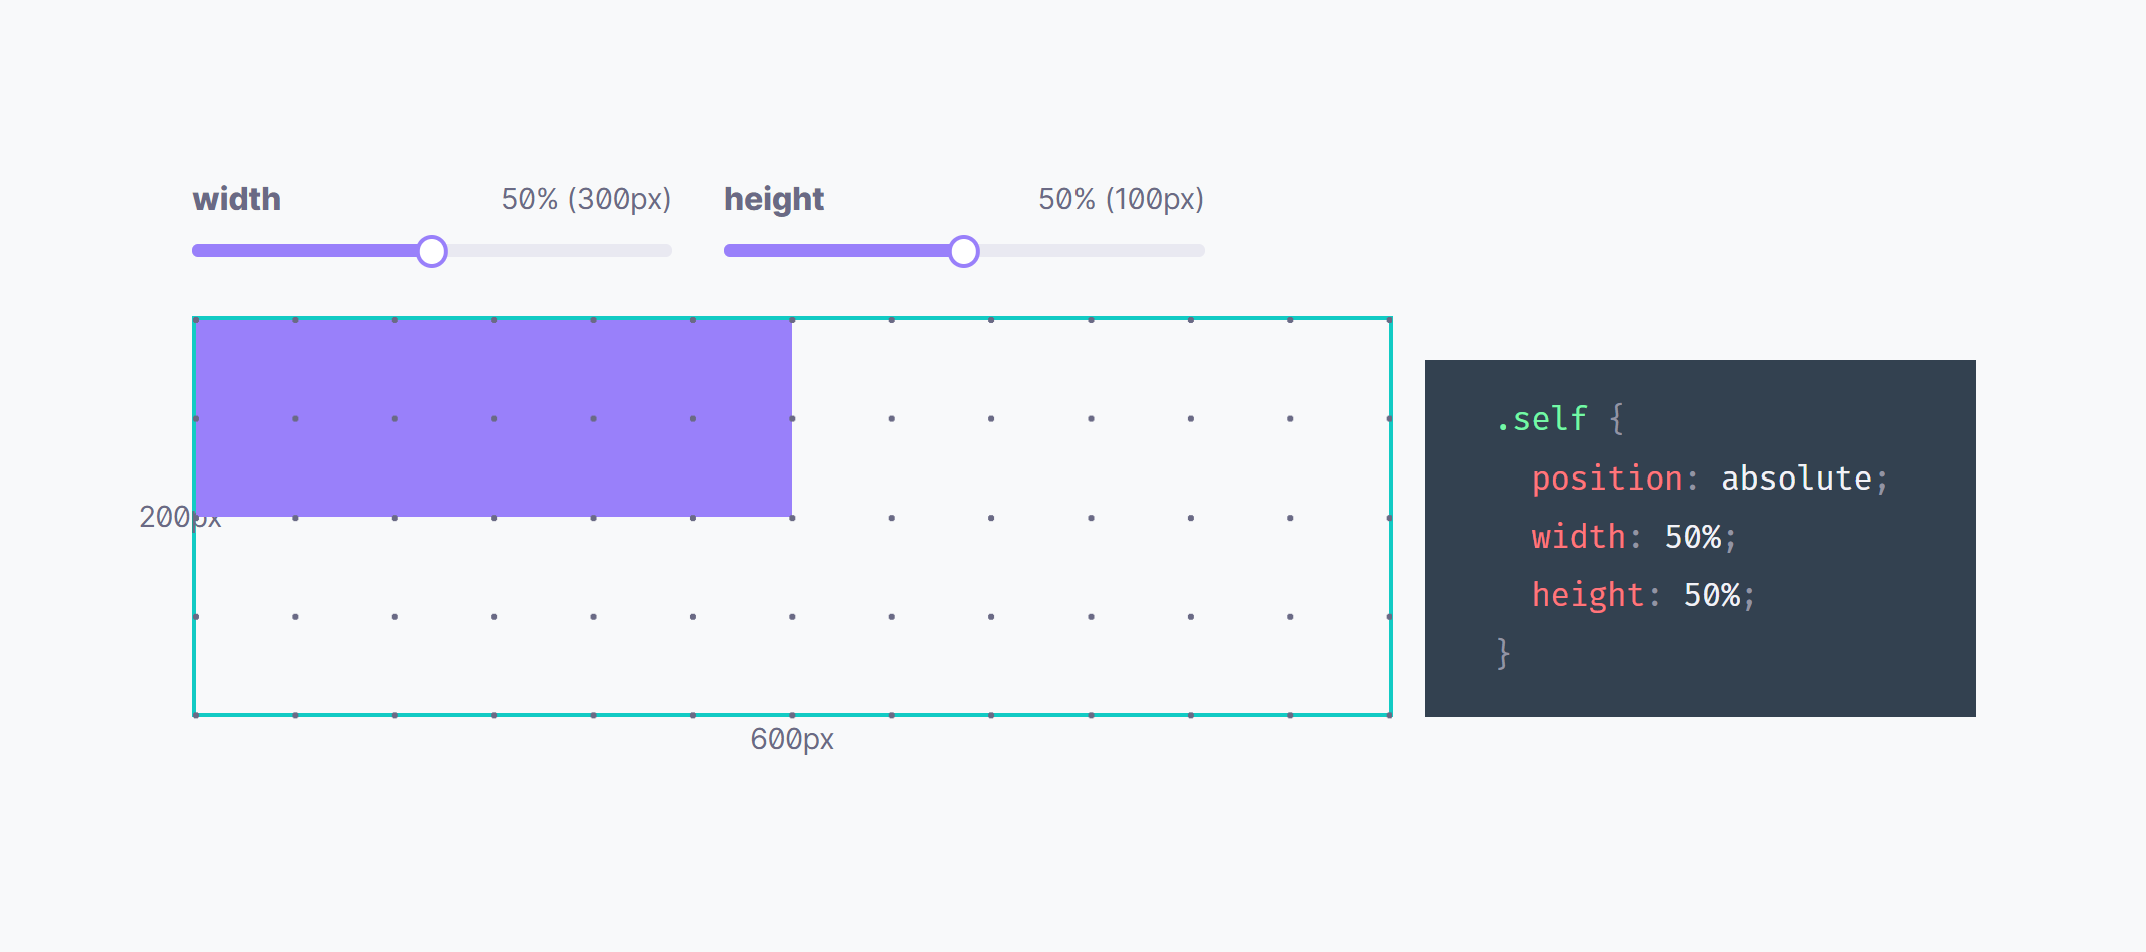
One of the CSS units I use most is the wonderful % — so handy for positioning elements on the page. Unfortunately, the rules aren’t exactly straightforward. One question I’m always asking myself is: Percent of what?
Speeding up force simulations with spirals
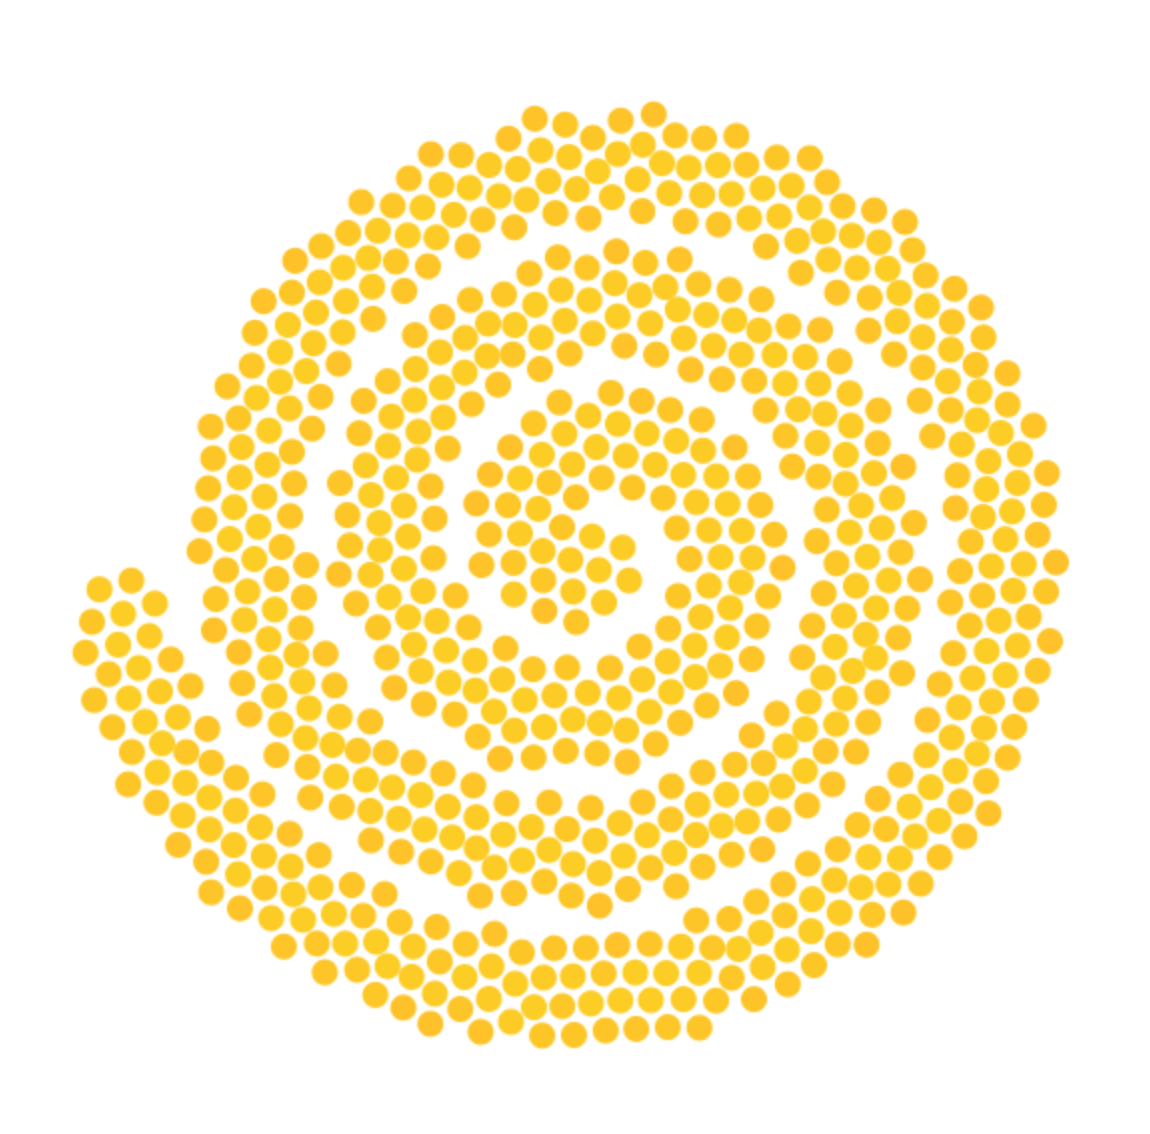
D3.js force simulations are great for implementing basic physical rules, but they can be expensive to run. Here's a trick I've used in the past to speed up those simulations.
How to create a Gauge component in React.js
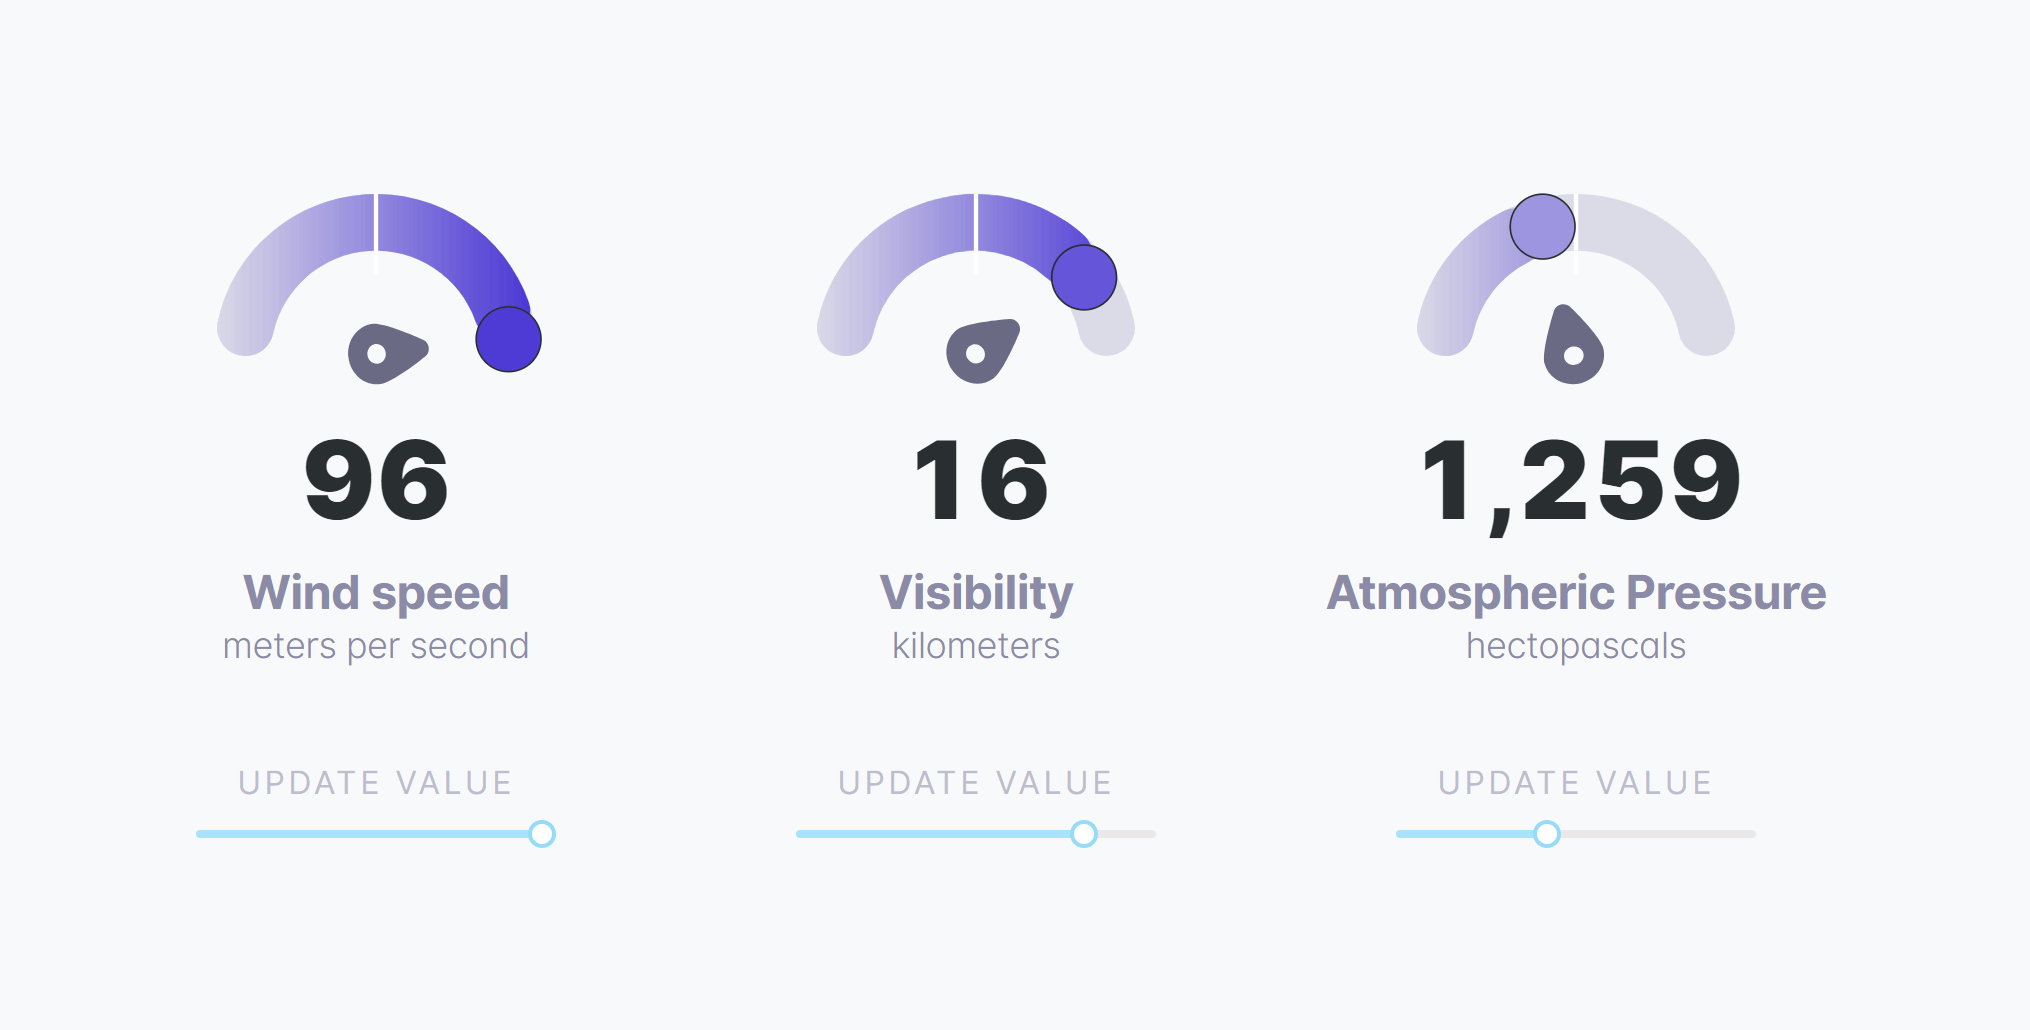
Let's create a Gauge in React! Gauges are great at showing context around a single value. Is it high or low? Is it larger or smaller than this other value? But what we'll learn here isn't really about creating a gauge, it's about learning the concepts we could use to create one.
The CSS Cascade
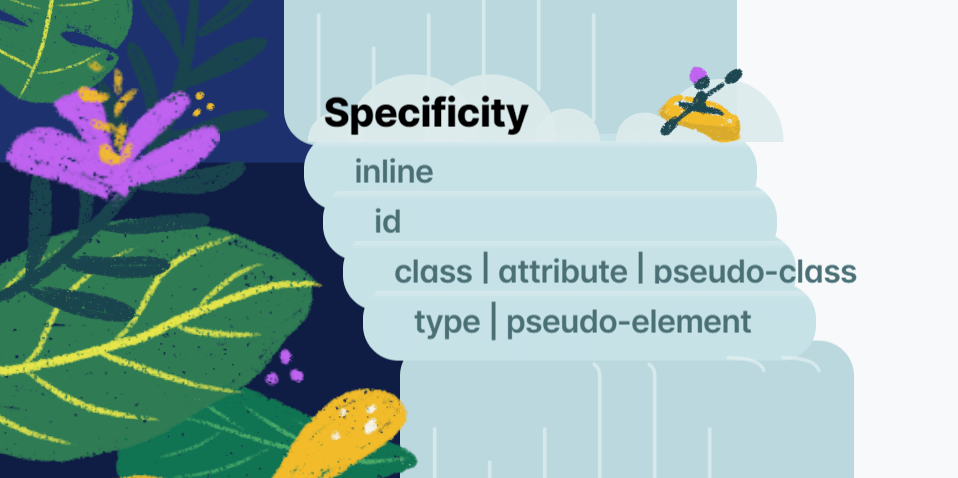
We style our websites using CSS, which stands for Cascading Style Sheets, but what does Cascading really mean? To save ourselves from future angst, let's take a step back and learn this thing for real.
Scaling SVG Elements
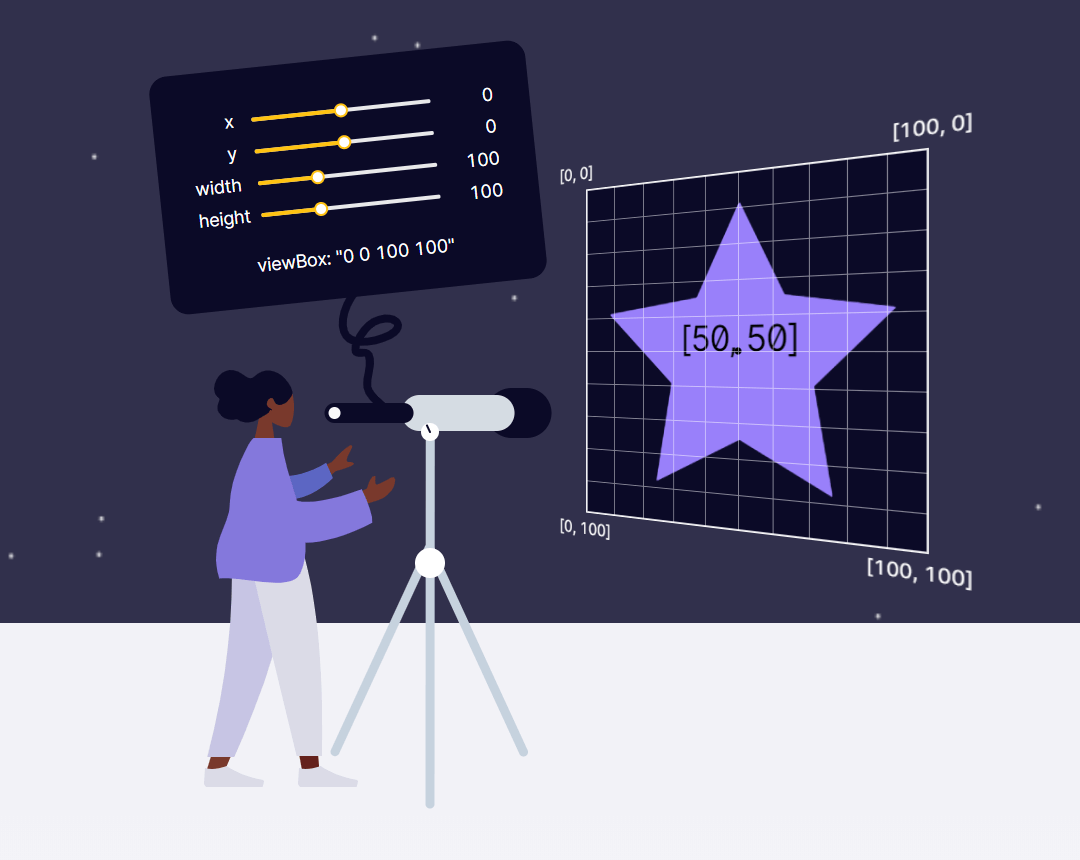
Scaling svgs can be a daunting task, since they act very differently than normal images. Instead of thinking of svgs as images, let's get an understanding of viewBox and change our mindset.
Thinking in React Hooks
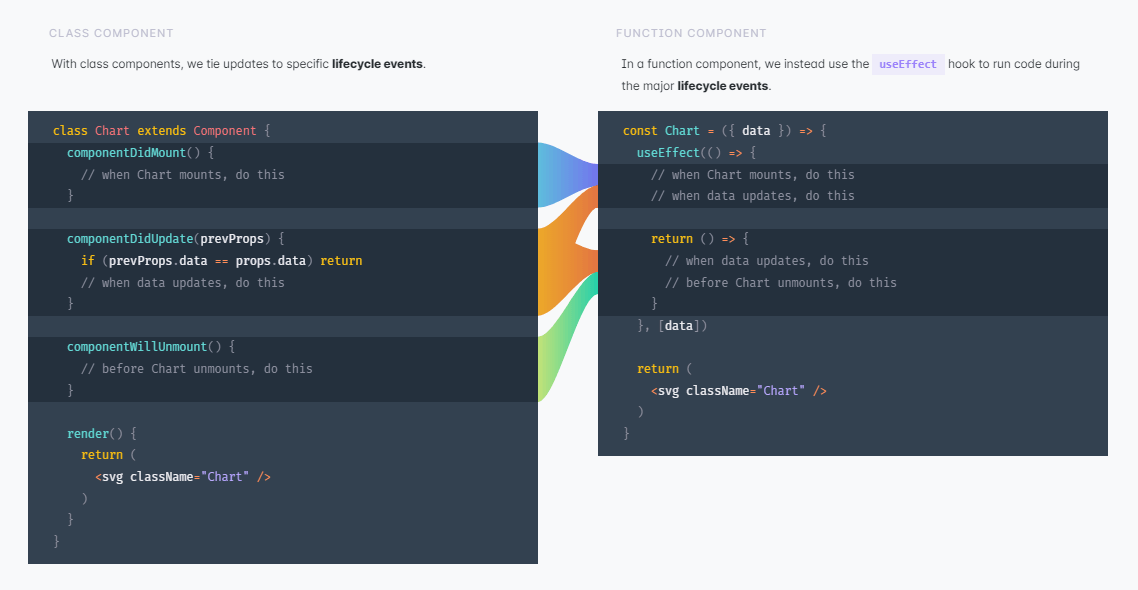
React introduced hooks one year ago, and they've been a game-changer for a lot of developers. There are tons of how-to introduction resources out there, but I want to talk about the fundamental mindset change when switching from React class components to function components + hooks.
How to learn D3.js
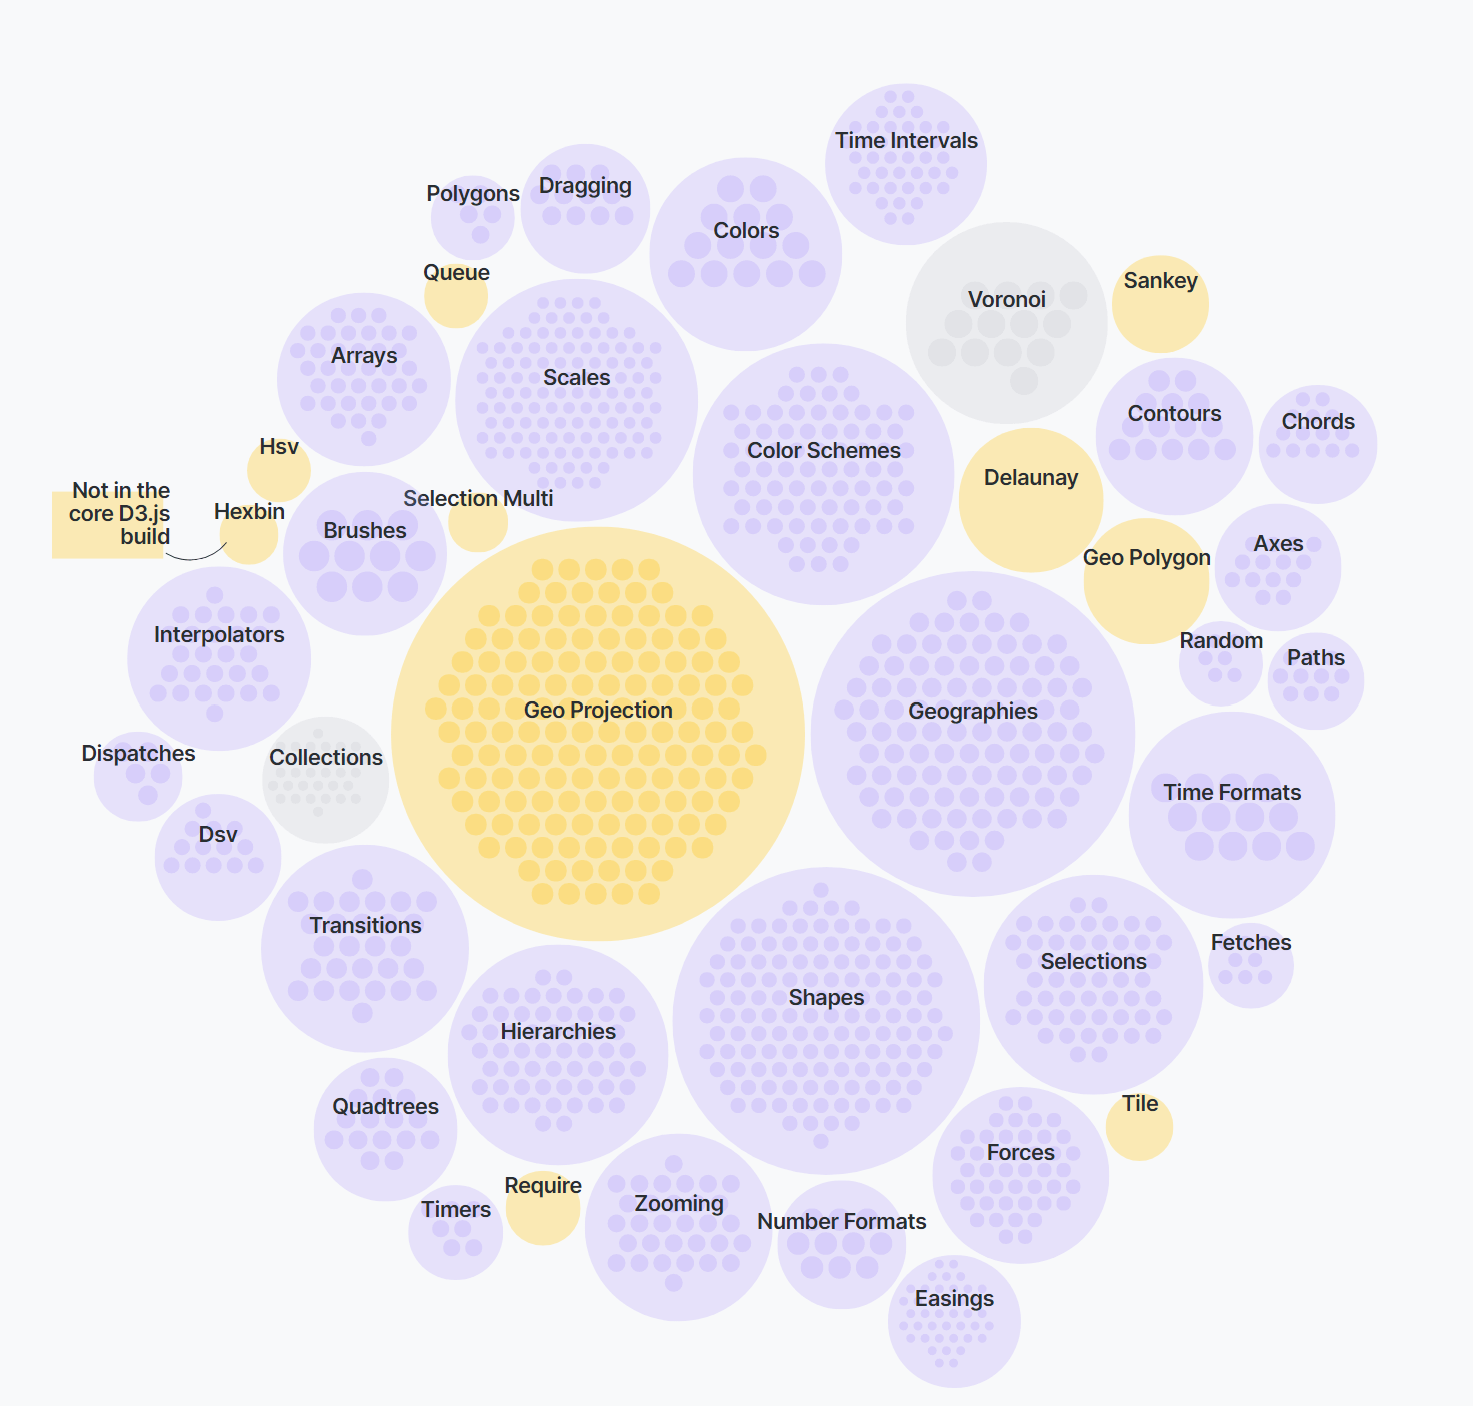
So, you want to create amazing data visualizations on the web and you keep hearing about D3.js. But what is D3.js, and how can you learn it? Let’s start with the question: What is D3?
Interactive Charts with D3.js
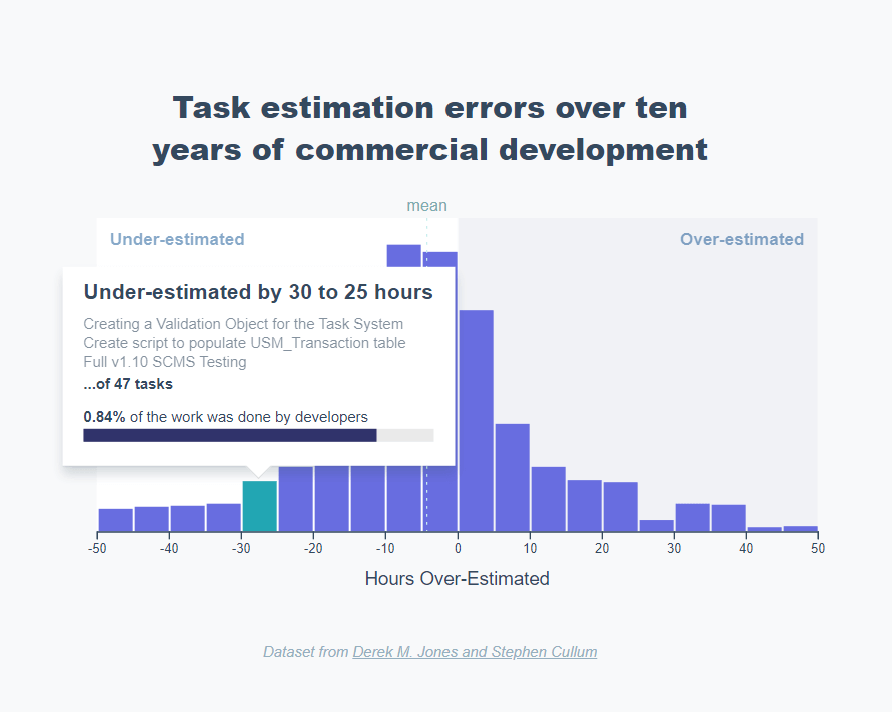
You did it! You grabbed a data set and visualized it, right here in the browser. Congratulations, that is no easy feat!
This is 2019 and the web browser opens up a whole new realm of possibilities when visualizing data.
- If a user wonders what the exact value of a data point is, they can hover over it and find out
- We can even show whole charts within a chart tooltip
- We can tell a story with a chart, progressively revealing parts of it as the user scrolls
Let’s take advantage of these new possibilities and talk about how to take your chart to the next level.